Skills used:
Digital transformation Product and Service Strategy
Customer Value Proposition Design
Product Ideation and pivoting
Directional Research/ Feedback loops/ Analytics/
Designing for Accessibility
Designing using big data and API integrations
Training and upskilling programs
Onboarding and change management
Employee engagement
Design Thinking tools used: Mindmapping, Qualitative and Quantitative interviews, Contextual enquiries, Competitive analysis, Journey Mapping, Personas, Generation of ideas.
Some components created for this project: - Onboarding process, search and displaying of dataset results, Quickstat area, blending of data results tools, collaboration and sharing of data area, creation and sharing of reports between collaborators. Full interactive prototype using Sketch/ Axure. Testing scripts, analysis of results, reporting back to Founders.
Short brief: Enable people to make well informed decisions using datasets and data blending tools, via an online platform, helping them identify areas of interest within their communities, and allocate funding where it's needed most.
Seer realised that if datasets were accessible and understandable to the decision makers within a community, it could highlight the areas of community that are of a concern and need urgent funding. Currently, council members could be guessing and speculating troubled hotspots, but if they had access to public data sets easily, and could understand and analyse them effortlessly, it could help them with their fund and resource allocations. They could identify priority areas through graphs and visualisations, and blend datasets to see whether their were patterns or correlations forming.
Make big data approachable and usable for those who can make a difference. But who could make a difference?
We had quite a bit of documentation when I started at Seer, and I soon came across the persona work. There were 2 original Personas: 'Carla' The Data Analyst Persona, and the PowerBroker Persona. I was assured that these were modelled on real people. They listed out the usual: interests, hobbies, lifestyle, attitudes and beliefs; and were designed nicely on an A4 page. Soon I found myself pondering how do I as a CX/UX strategist really get the most from this information, to create a human centric design, that will fit perfectly into their world? It's nice to have this artefact, but what do I do with it, or build upon it?
Becoming acquainted with 'Carla' The data Analyst...
When trying to understand what 'Carla the data analyst' does all day, how she really thinks, feels, acts, etc. I like to have another document going which makes me think about her job objectives using a 'Jobs to be done' lens. These 'jobs to be done' statements would be the typical tasks that could be done over a time period: day/month/quarter ect. This included pulled quotes and references from previous persona work, and interviews already in possession.
I have also categorised this into a before thoughts of Carla before the 'task' is carried out, During when the 'tasks' are carried out what is Carla wanting to achieve, and Output what Carla wanted to achieve by those 'tasks' being carried out in a successful manner.
Jobs to be done for 'Carla', our persona:
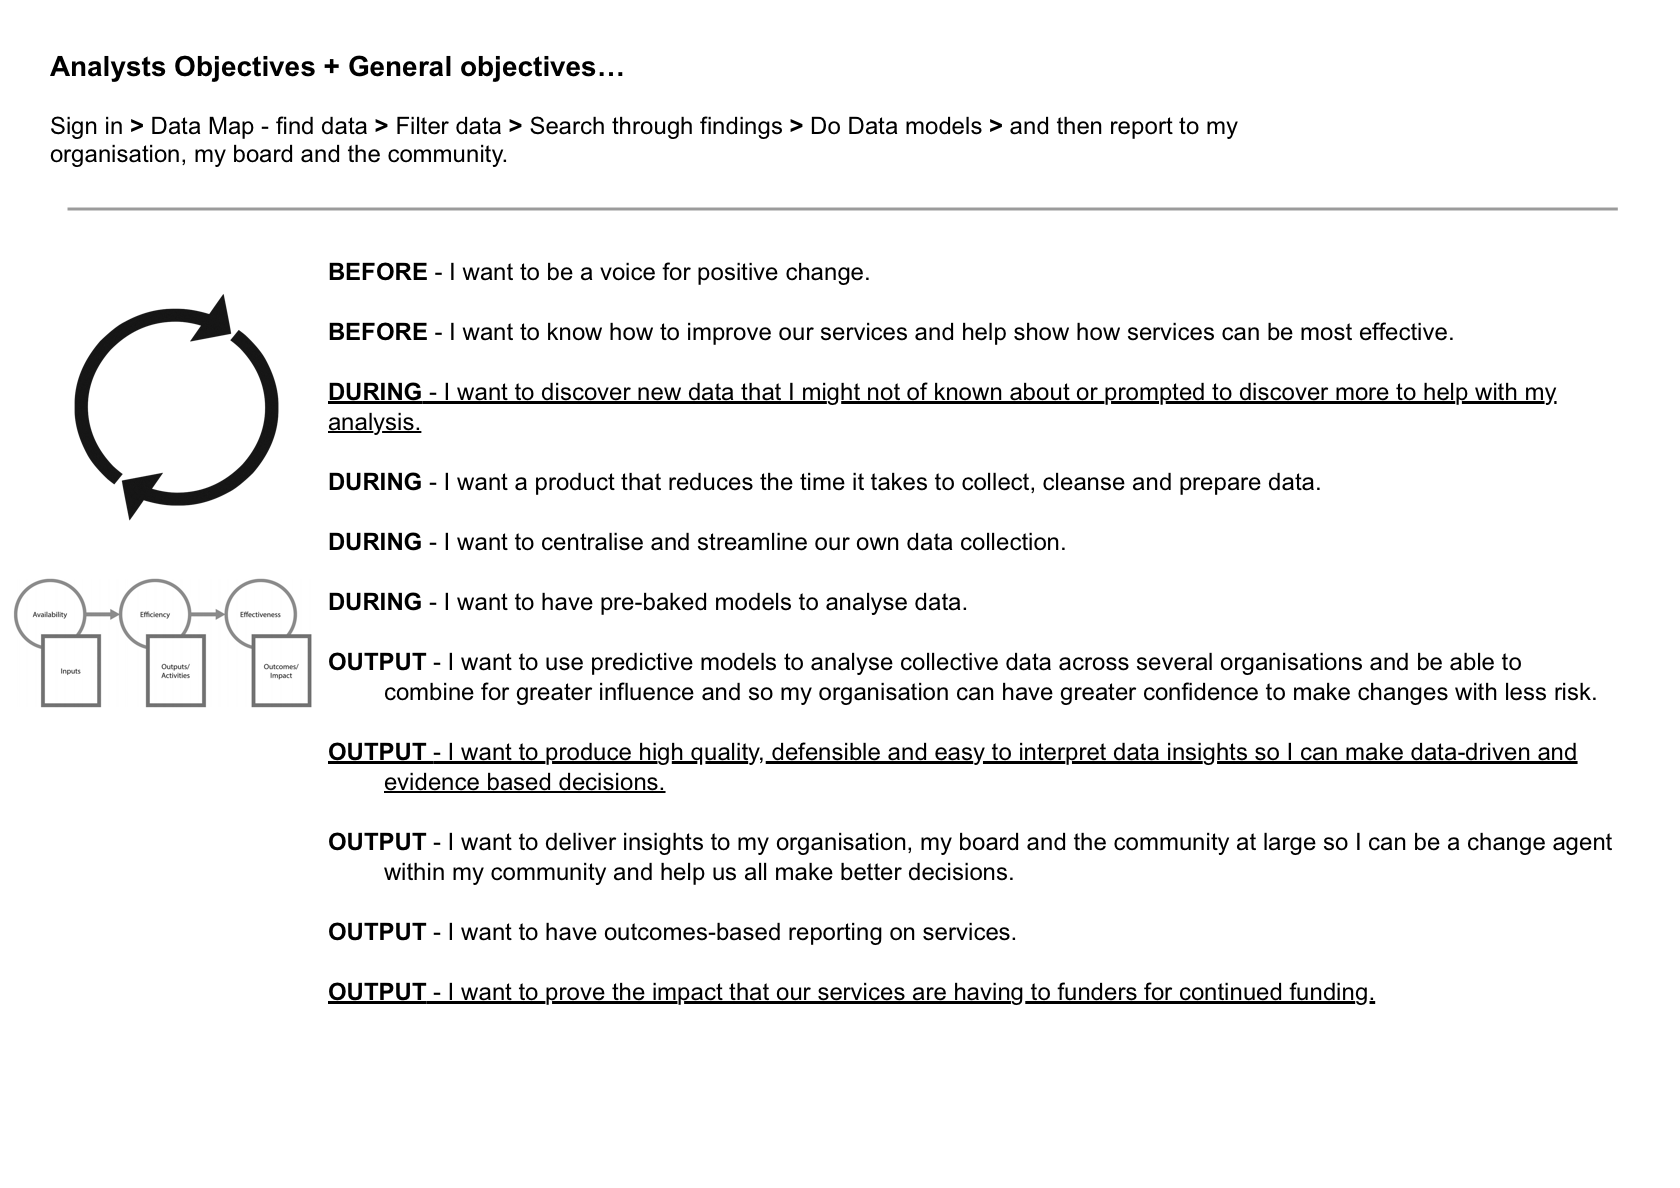
A sample flow to help me order my thoughts: Sign in > Data Map - find data > Filter data > Search through findings > Do Data models > and then report to my organisation, my board, and the community.
- Before: I want to be a voice for positive change.
- Before: I want to know how to improve our services and help show how services can be most effective.
- During: I want to discover new data that I might not of known about or prompted to discover more to help with my analysis.
- During: I want a product that reduces the time it takes to collect, cleanse and prepare data.
- During: I want to centralise and streamline our own data collection.
- During: I want to have pre-baked models to analyse data.
- Output: I want to use predictive models to analyse collective data across several organisations, and be able to combine for greater influence, so that my organisation can have greater confidence to make changes with less risk.
- Output: I want to produce high quality, defensible and easy to interpret data insights so I can make data-driven and evidence based decisions.
- Output: I want to deliver insights to my organisation, my board and the community at large so I can be a change agent within my community and help us all make better decisions.
- Output: I want to have outcomes-based reporting on services.
- Output: I want to prove the impact that our services are having to funders for continued funding.
I had my list. What now?
My choice was to feature the following.
All points are of interest, but I gave these priority due to the business objectives, and that these choices could form an early MVP (minimum viable product). Some of the objectives will be naturally covered while researching/ addressing another. For my research purposes I chose three items to start:
- During: I want to discover new data that I might not have known about, or be prompted to discover more to help with my analysis.
- Output: I want to produce high quality, defensible, and easy to interpret data insights so I can make data-driven and evidence based decisions.
- Output: I want to prove the impact that our services are having, to funders, for continued funding.
Some questions asked in the initial interview process to explore the above objectives:
- During:
- Q/ How do people ask you to help them with their data query? Could you give me an example?
- Q/ How do you currently know which data sets to use or search for when you are compiling a report?
- Output:
- Q/ How do you select what visualisations are used to express your data findings? Why do you select those options?
- Q/ Have you ever had to further explain your data visualisations? What needed explaining?
- Q/ What type of questions could you get asked during question time, in a meeting you've just presented in? (or concerns if not presented)?
- Output:
- Q/ How would you currently develop an understanding about the change that's happening, thanks to your earlier analysis?
- Q/ How do you want to report to your founders regarding the impact of your work?
Other than finding out about your product and what they need...
Also super interesting to ask questions to cover CSAT (Customer satisfaction of using your product), CES (Customer Effort Score to navigate your product), NPS (Net Promoter score - would they recommend your product) asked at all stages of prototyping (component design > high end designs). Finding out this dramatically helps the designs to move forward and see whether iterations (via numerical data) are making your users lives easier and happier!
eg question:
-
Q/ Interviewee: How intuitive was this for you? (Show a scale with pre-defined entries)
Interviewer to write down: (did you have to help them in anyway to go through this flow)?
(Did they complete the task straight away or did the interviewee take their time - got there in a round about way)?
The results started coming in...
During the testing phase, a regional visit and a plethora of questions later, it was revealed that there was another persona that our team had not yet explored. Yes, there were data experts happily working with data, but it was also uncovered that there were many people participating in the Lighthouse Project wanting to work with the data. But they were daunted by the thought. They didn't feel like they could contribute to the research stage, or felt like they couldn't add to group discussions about data. They wanted to participate and make a difference within the community. The question that I had to answer was: how could they contribute??
It made us pivot our thinking.
These people were enthusiastic locals, passionate about wanting to see a change within their community. They were from different backgrounds, ethnicities, and education levels, and they all had fabulous contributions to make. Realising that this project couldn't flourish without these voices, we knew we had to pivot the Seer Data Platform from its focus on Data Analysis, to make it more inclusive. To make sure that what we were building was accessible to all collaborators and stakeholders of the analysis. Make sure we include a way for all people to contribute, to work together in a collaborative environment, so we can achieve the best possible outcome for the community.
Key themes discovered from the research phase
- Not everyone is data oriented, and there are a wide range of capabilities and skills
There is a diverse community who are at different stages of their data story and have a wide range skills and capabilities.
- Data can seem intimidating, or daunting, about what it could reveal if uncovered
What will this data reveal if it is uncovered. Do we want to open the 'can of worms'.
- Technical jargon can often get in the way of understanding when technical jargon gets in the way of general participation
- Not everyone is on a level playing field when working with data People don't always have the confidence to work with data.
- Clarity at all levels no matter your data knowledge so that data and it's possibilities can be communicated across all levels.
- Keeping people interested and enthusiastic in our offering If people can't connect with it, they will lose interest.
Conclusion
The themes that materialised from the research helped our team align all our designs going forward. It helped me think about the product feature that I was designing, and how to make sure that users from both ends of the data spectrum could use it. If it wasn't usable by all, how could we make sure others did not miss out? We pivoted from an initial data search, blend and reveal platform, to one that the community could all participate amongst. Like to see how? Get in touch!